|
| Milford
Haven Tide Tables & Weather |
|
| |
Please
note that the data contained in these tide tables does not account
for adverse weather conditions which may affect the tidal ranges.
They should not be used for navigational purposes.
Llantrisant SAC cannot accept responsibility for any errors
in the data.
Click on the links below to access the tide tables by month
|
|
| |
|
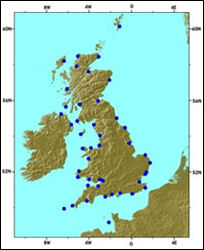 More
tidal data for Milford Haven and other ports around the
UK can be found on the website of the National Tidal and Sea
Level Facility. More
tidal data for Milford Haven and other ports around the
UK can be found on the website of the National Tidal and Sea
Level Facility.
This is
part of the The Proudman Oceanographic Laboratory (POL), which
is a part of the Natural Environment Research Council. Where
they carry out research on the following:
-
Wind-wave
dynamics & sediment transport
-
Global
sea level and geodetic oceanography
-
Estuary,
coastal and shelf sea circulation & ecosystem dynamics
-
Marine
technology & operational oceanography
To access
this data click on the UK map (right).
|
|
| Weather
Information Sites |
|
|
| |
| |
 |
| |
|
|
| |
|
|
|
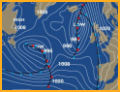
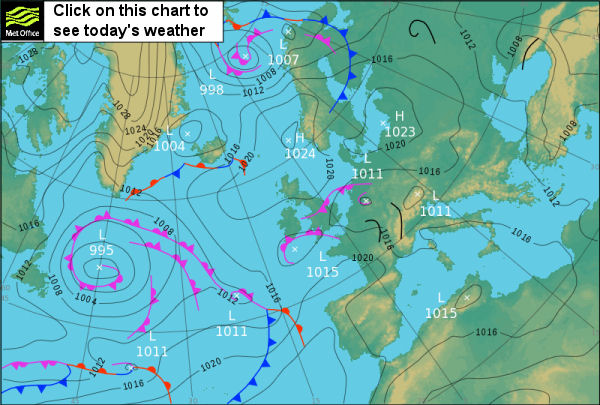
Atlantic
Weather Chart
|
|
 |
|
| Useful
Telephone Numbers & Links |
| Milford
Haven Coastguard |
01646
690909 |
| Weathercall |
0891
505314 |
| Marine
Call (weather) Wales |
0891
505360 |
| Marine
Call (weather) Bristol Channel |
0891
505359 |
| Withybush
Hospital (Haverfordwest) |
01437
764545 |
| Haverfordwest
Police |
01437
763355 |
| South
Pembrokeshire Police |
01646
682121 |
|
|
|
|
|
The
Shipping Forecast...
issued by the Met Office, on behalf of the Maritime and Coastguard
Agency. |
|
|
| |
|
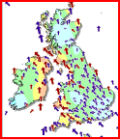
Sea
Areas around the UK
(used in the shipping forecast)
Also showing some of the coastal weather stations
|
| |
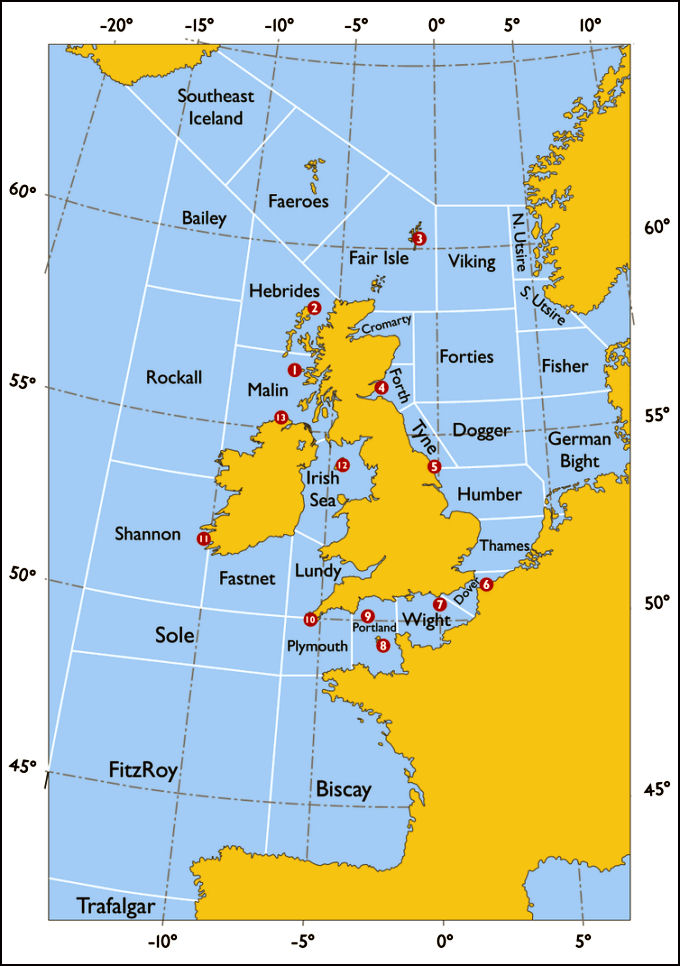 |
The
coastal weather stations named in the Shipping Forecast
(some numbered on the map) are: |
| Tiree
(Automatic) (1) |
Sandettie
LV (Automatic) (6) |
Valley |
| Stornoway
(2) |
Greenwich
LV (Automatic) (7) |
Liverpool
Crosby |
| Lerwick
(3) |
St.
Catherine's Point (Automatic) |
Valentia
(11) |
| Wick
(Automatic) |
Jersey
(8) |
Ronaldsway
(12) |
| Aberdeen |
Channel
LV (Automatic) (9) |
Malin
Head (13) |
| Leuchars
(4) |
Scilly
(Automatic) (10) |
Machrihanish
Automatic |
| Boulmer |
Milford
Haven |
|
| Bridlington
(5) |
Aberporth |
|
|
|
|
| Note:
LV = Light Vessel |
|
| |
|
Shipping
Forecast Terminology
|
| Gale
warnings |
| Gale
Force |
Winds
of at least Beaufort force 8 (34-40 knots) or gusts reaching
43-51 knots |
| Severe
gale |
Winds
of force 9 (41-47 knots) or gusts reaching 52-60 knots
|
| Storm
Force |
of
force 10 (48-55 knots) or gusts reaching 61-68 knots |
| Violent
storm |
Winds
of force 11 (56-63 knots) or gusts of 69 knots or more
Hurricane force Winds of force 12 (64 knots or more) |
| Imminent
|
Expected
within six hours of time of issue |
| Soon |
Expected
within six to 12 hours of time of issue |
| Later
|
Expected
more than 12 hours from time of issue |
| Visibility
|
| Fog |
Visibility
less than 1,000 metres |
| Poor
|
Visibility
between 1,000 metres and 2 nautical miles |
| Moderate |
Visibility
between 2 and 5 nautical miles |
| Good |
More
than 5 nautical miles |
| Movement
of pressure systems |
| Slowly |
Moving
at less than 15 knots |
| Steadily |
Moving
at 15 to 25 knots |
| Rather
quickly |
Moving
at 25 to 35 knots |
| Rapidly |
Moving
at 35 to 45 knots |
| Very
rapidly |
Moving
at more than 45 knots |
| Pressure
tendency in station reports |
| Rising
or falling slowly |
Pressure
change of 0.1 to 1.5 hPa in the preceding three hours
|
| Rising
or falling |
Pressure
change of 1.6 to 3.5 hPa in the preceding three hours
|
| Rising
or falling quickly |
Pressure
change of 3.6 to 6.0 hPa in the preceding three hours
|
| Rising
or falling very rapidly |
Pressure
change of more than 6.0 hPa in the preceding three hours
|
| Now
rising or falling |
Pressure
has been falling (rising) or steady in the preceding three
hours, but at the time of observation was definitely rising
(falling) |
Wind
(direction Indicates the direction from
which the wind is blowing) |
| Becoming
cyclonic |
Indicates
that there will be considerable change in wind direction
across the path of a depression within the forecast area
|
| Veering
|
The
changing of the wind direction clockwise, e.g. SW to W
|
| Backing
|
The
changing of the wind in the opposite direction to veering
(anticlockwise), e.g. SE to NE
|
|
|
|
The
Beaufort Wind Scale
|
|
Force
|
Wind
Speed
(knots)
|
Description
|
Observations
& wave size.
|
|
0
|
0
|
Calm
|
Flat
calm - Sea like a mirror.
|
|
1
|
1-3
|
Light
Air
|
Small
ripples without crests. 0.1m
|
|
2
|
4-6
|
Light
Breeze
|
Small
wavelets. Crests do not break. 0.2m
|
|
3
|
7-10
|
Gentle
Breeze
|
Large
wavelets. Crests begin to break. 0.6m
|
|
4
|
11-16
|
Moderate
Breeze
|
Breaking
waves. Fairly frequent white horses. 1.0m
|
|
5
|
17-21
|
Fresh
Breeze
|
Moderate
waves. Many white horses and sea spray. 2.0m
|
|
6
|
22-27
|
Strong
Breeze
|
Large
waves. White crests and spray everywhere. 3.0m
|
|
7
|
28-33
|
Near
Gale
|
Sea
heaps up. White foam begins to be blown in streaks.
4.0m
|
|
8
|
34-40
|
Gale
|
Moderately
high waves of greater length. Foam blown in well marked
streaks. 5.5m
|
|
9
|
41-47
|
Strong
Gale
|
High
waves. Dense streaks of foam. Crests begin to roll over.
Spray affects visibility. 7.0m
|
|
10
|
48-55
|
Storm
|
Very
high waves with long overhanging crests. Dense white
streaks of foam . Rolling sea becomes heavy. Visibility
reduced. 9.0m
|
|
11
|
56-63
|
Violent
Storm
|
Mountainous
waves. Sea completely covered with foam. Visibility
affected. 12.0m
|
|
12
|
64+
|
Hurricane
|
Sea
completely white with driving spray. Air filled with
foam and spray. Visibilty seriosly reduced. 14m+
|
-----
|
0
- 3
|
Suitable
for diving anywhere around the coast. |
|
4
- 5
|
Diving
within the prescribed area only. (see Club Rules). |
|
6
- 7
|
Sea
too rough - if already out, return to shore. |
|
8
- 9
|
Stay
at home - don't even consider launching. |
|
10
-12
|
Check
your home insurance policy! |
Note:
The NOAA Small Craft Advisory regards sustained winds 25 knots
or greater and seas 10 feet (3m) or greater to be hazardous
to small craft. This equates to Beaufort Force 6. As a club
we do not operate in conditions equal to Force 5 or above. |
|
|
Weather
and diving.
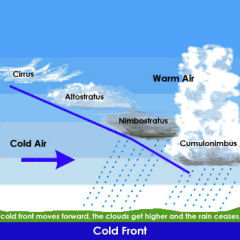
 The
Highs and Lows of UK Weather The
Highs and Lows of UK Weather
The
UK's mid latitude position between 50 - 60°N leaves it
between the warm south and the cold north. The atmosphere
is driven by a need to reduce this temperature gradient by
sending warm air north and cold air south using cyclones and
anticyclones, or the highs and lows which make up our 'synoptic-scale'
weather, and which we see on the pressure charts.
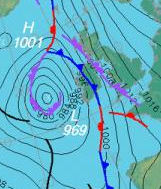
When low pressure systems form in the western Atlantic, they
pick up warm moist air which is then mixed with cooler air
from the north as they move east across the top of the Azores
high. The boundaries between these air masses are marked by
fronts.
A typical anticlockwise rotating low centre will reach western
Ireland and then curve north up the western Scottish coast.
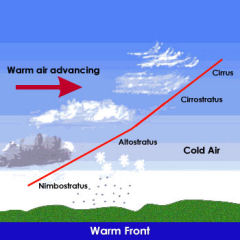
The warm front moves across the UK first, with warm moist
air behind it bringing spells of rain and often reduced visibility
with south to south westerly winds. The cold front chasing
along behind is the boundary between this warm moist air,
and the cooler more unstable brighter and more showery weather
behind, with winds typically from the south west to north
west.
 |
The transition
of these fronts is something the diver has to take note of
as the passage of these fronts over head will bring strong
winds and occasionally heavy rain which can quickly turn a
pleasant day's diving into a dash for shore.
High pressure usually follows these low pressure systems.
These anticyclones are clockwise rotating sinking air masses
which we associate in the summer season with light winds and
sunny skies, and often building afternoon onshore or sea breezes.
The pressure
imbalance created between the high and low pressure areas
is what drives the wind as it tries to reduce this pressure
gradient. Wind which we see on the water is, in the northern
hemisphere, more backed (further left looking upwind) than
this 500m pressure gradient wind due to the effect of friction
or drag on the wind by the surface.
The rougher the surface the more drag on the wind, i.e. winds
are more backed over the land (20 - 40°) than they are
over the smoother sea (10 - 20°). This is something to
look for on the water when winds are blowing off the shore,
as they will veer (clockwise, or shift right looking upwind)
downwind of the shore.
Heat from
the sun has a noticeable effect of the surface winds. How
many mornings have you looked out the window to see calm conditions
but by lunchtime the winds have picked up nicely?
During the night the earth cools and so in turn it cools the
air directly above it, which reduces its 'energy' or mixing
and so reduces the wind speed.
As the sun heats the earth, the air next to the surface begins
to warm and so begins to rise and mix as cooler air sinks
to the surface to replace it, which results in an increased
wind speed.
Friction and heating are just two examples of the many factors
which we must take into account when on the water. The forecasts
we receive are often for a much wider area and there are small
scale processes which affect the local winds.
|
| |
|
 Miles
or Nautical Miles? Miles
or Nautical Miles?
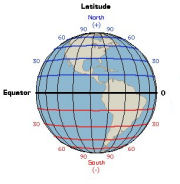
The nautical mile is based on the circumference of the earth
at the equator.
Since the earth is 360 degrees of longitude around, and degrees
are broken into 60 "minutes", that means there are
360 * 60 = 21,600 "minutes" of longitude around
the earth.
This was taken as the basis for the nautical mile; thus, by
definition:-
1 minute of longitude at the equator is equal to 1 nautical
mile.
For geometrical reasons, we use the minute of latitude on
charts to correspond to a nautical mile rather than the minute
of longitude. Minutes of longitude shrink as they move away
from the equator and towards the poles; minutes of latitude
do not shrink.
So the earth is ideally, by definition, 21,600 nautical miles
(and 21,600 "minutes" of longitude) in circumference
at the equator. (By the way, the nautical mile is about 1.15
larger than the "statute" mile used by land lubbers).
| To
convert Miles to Nautical Miles - Multiply by 0.86 |
| To
convert Nautical Miles to Miles - Multiply by 1.15 |
Example:
Our boat insurance policy allows us to operate 20 (land) miles
from shore.
Therefore in nautical terms we can operate 20 * 0.86 = 17.2
nautical miles from shore.
|
|
|
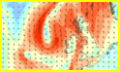
The
Jet Stream
|
The
jet stream is a strong flowing ribbon of air that
flows around our planet high up in the atmosphere, at
around the level of the tropopause.
Situated between the troposphere and the stratosphere,
the Jet Stream is approximately 11 kilometres above
the surface of the Earth at the poles and around 17
kilometres above the surface of the Earth at the equator.
The jet stream flows at around 160kmph (100mph).
We often hear that the jet stream is responsible for
influencing the weather in the UK, so it is natural
to wonder what causes the jet stream and why it has
such an influence on the weather we experience on the
ground.
|
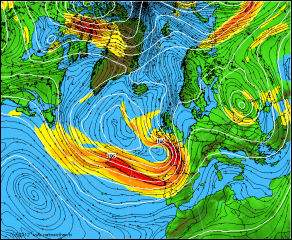
Click
on the map above to see the Jet Stream |
| |
|
|
Jet
streams form and are strongest where variable air temperature
gradients are steepest. This is normally seen in two
zones:
Summary
of the Jet Stream and the weather it creates:
-
The
position of the jet stream over the UK determines
the type of weather we experience.
-
If
the polar front jet is situated significantly to
the south of the UK we will experience colder than
average weather.
-
If
the polar front jet is situated to the north of
the UK we will experience warmer than average weather.
-
If
the polar front jet is situated over the UK we will
experience wetter and windier than average weather.
-
If
the polar front jet has a large amplification then
cold air will travel further south than average
and warm air will travel further north than average.
-
The
direction and angle of the jet stream arriving at
the UK will determine what source of air (i.e. cold,
dry, warm, wet, from maritime or continental sources)
the UK experiences.
|
|
|
Global
Weather Data
Weather data from popular locations visited by
the club |
|
|
| |
|
| |